The versatility of statistics and data science across majors
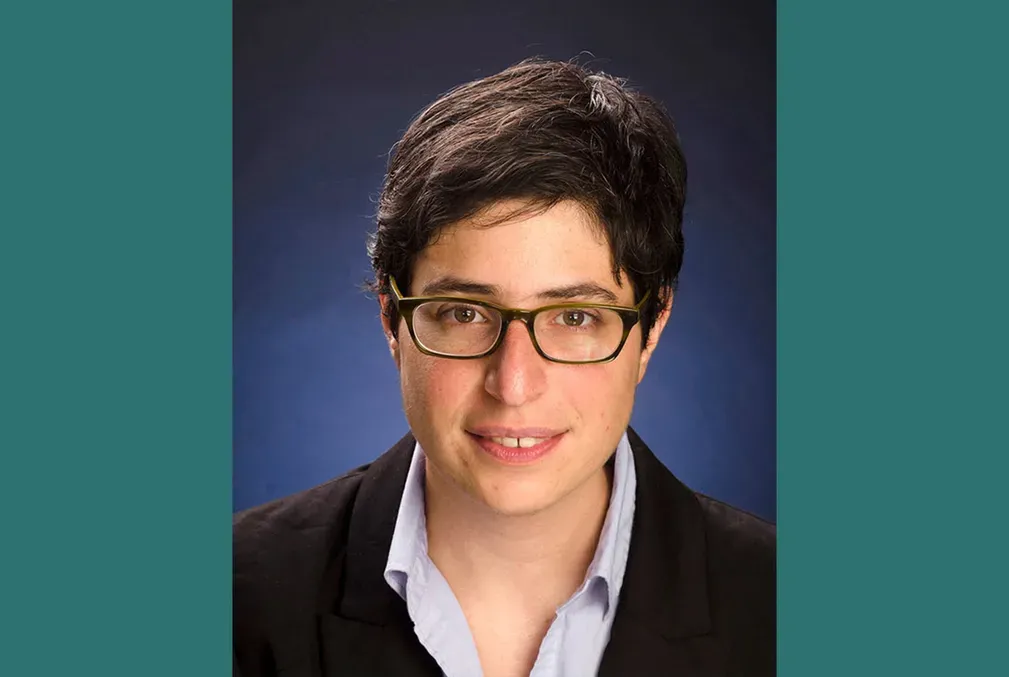
Statistician Dennis Sun is on a mission to help students see how statistics, data science, and probability apply to their everyday lives by infusing the introductory college courses in these subjects with relatable examples; getting data into the hands of students early; and making his new online statistics textbook freely available—and accessible—for everyone.
If you poked your head into the classroom of Stanford statistician Dennis Sun, you might be surprised by what you see. On one day, you might observe students tossing a beach ball-sized inflatable globe back and forth. On another day, you might see students circling their birth dates on a calendar, performing a Coke versus Pepsi taste test, or counting the clicks of a Geiger counter as it detects radiation.
These activities may seem outlandish, but they are tangible examples of ways we can measure uncertainty and variability—two key concepts in the fields of statistics, data science, and probability.
Creating courses that inspire students to dream up unconventional, useful, and (frequently) fun ways to apply these disciplines to their academic interests and daily lives drives the work of Sun, an associate professor (teaching) of statistics in the Stanford School of Humanities and Sciences and a data scientist at Google.
Sun earned his doctorate in statistics at Stanford in 2015 and joined Stanford’s faculty in 2023. Since then, he has been working to demystify these subjects and help students see that these topics have many practical applications.
“I’ve always been interested in applying statistics to topics you don't traditionally think of,” Sun said. “When I came to Stanford as a graduate student in statistics, I took classes in the music department.”
His subsequent research applied audio signal processing methodology to music, such as the problem of separating out the different instruments in a recording. Building on this research, Sun then applied these methods to speech recognition in noisy recordings.
Blending music with statistics may seem like a disparate mashup but statistics can be applied to just about anything, Sun explained. Unfortunately, statistics and data science aren’t being applied as widely as they could be. One possible reason is that people tend to view these topics as tools for mathematicians and statisticians, and as a result they aren’t always taught in a way that is accessible to everyone.
“Starting with formulas and theorems may work well for students who want to be professional statisticians, but that may not be the best way to connect with all the students who will need statistics in their lives,” Sun said.
This is especially true for students who are exploring career paths and have yet to discover how statistics, probability, and data science could be relevant to their academic interests.
Students interested in pursuing majors in economics, engineering, or biology may not know that data science can be used to, for example, predict house prices and online shopping behavior, identify the variables that affect fuel efficiency for different models of cars, and reveal the likely location of an endangered animals’ territory so conservation efforts can focus there.
“Concrete examples that people can connect with help make statistical concepts more accessible,” Sun said. “We live in a world where uncertainty is inevitable. Statistics is fundamentally about quantifying that uncertainty and using that information to help us make decisions.”
Piquing the interest of students early
Sun will become director of the Program in Data Science this fall. It is perhaps fitting that he took on the challenge of rethinking the way statistics, data science, and probability are being taught at the introductory college level, because his own interest in statistics was profoundly influenced early in his college career.
“In college I took a very inspirational probability class from a professor who I still consider a mentor today—Joe Blitzstein, professor of statistics at Harvard,” Sun said. “I was a math and music major, but that class led me to take more statistics classes. When I graduated, statistics was what I wanted to do.”
Sun is currently reimagining three essential introductory courses related to data science, statistics, and probability that students take as undergraduates—Principles of Data Science (DATASCI 112), Introduction to Statistics for Engineers and Scientists (STATS 110), and Introduction to Probability (STATS 117).
“Many students are required to take an introductory statistics class for their major, and many of them are not looking forward to that class,” Sun said. “I'm interested in showing them how statistics can be relevant to their lives, their majors, and their careers.”
To achieve this, Sun pairs relatable scenarios with everyday objects to create memorable learning experiences for his students. One example he recently used in his class involves tossing a large inflatable globe around the classroom.
Sun pulled a beach ball-sized inflatable globe out from behind his desk, tossed it up in the air, and caught it, making a satisfying slap.
“To illustrate a certain idea in statistics called a confidence interval, I pose this question to the class: ‘What percentage of Earth is covered by water, and how could we estimate that?’” Sun said. “Eventually, a student will suggest tossing the inflatable globe around the room. Whenever a person catches it, you see if their finger lands on water or land.”
The students throw the inflatable globe around the room from person to person, tallying the number of times their right index finger lands on water. If, for example, that number is 13 out of 20 times, the corresponding estimate is that 65% of Earth is covered by water.
“The students quickly realize there's some uncertainty associated with that number,” Sun said. “Because if we toss the globe around the class another 20 times, the result might be 15 out of 20, or maybe 12 out of 20. The experience really illustrates the idea of variability and uncertainty, which are central to statistics.”
Getting data into the hands of students early
In addition to his efforts to improve the way that introductory statistics, data science, and probability are being taught, Sun is using two other approaches to make these topics more accessible. The first is getting data into the hands of students early.
Traditionally, students must take several courses in math and probability before they get the opportunity to work with data.
“Working with actual data is what gives students a sense of what data science is all about,” Sun said. “So I created a first-year data science class that students can take their second quarter at Stanford, even if they haven’t taken math courses yet.”
Sun hopes that giving students the option to work with data during their first year of college will be a turning point for them as they weigh different academic paths.
“I’m also working to serve the broader community as well,” Sun said. “How can we, as a society, develop more statistical literacy and help reach more people?”
Sun and two Stanford colleagues in statistics, lecturer Gene Kim, and doctoral scholar Anav Sood, just published a free textbook, The Art of Chance: A Beginner's Guide to Probability, that is available online for anyone who wants to learn more about the topic in a reader-friendly and approachable way.
People are increasingly seeing the value of statistics and data science, Sun explained. But there is still much that can be done to help students get a solid grasp of the fundamentals of these subjects and—hopefully—inspire them to keep studying and learning about these topics in the future.
“When I started as a doctoral student at Stanford, if I told someone I was a statistician, I’d get comments like, ‘statistics, oh I hated that course,’” Sun said. “I think that’s changing. More often you hear, ‘I love my stats course.’”


